Here are several interesting graphs plotted with Advanced Grapher.
 | Regression
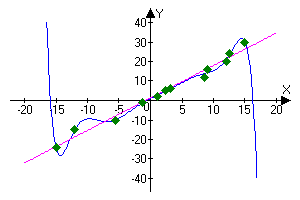
The equations of curves are obtained with the help of the regression analysis of the tabular data (which are shown by points)
Y(x)=-(1.1100319*10^(-8))*x^9 + (4.2010685*10^(-8))*x^8 + (4.8204417*10^(-6))*x^7 - (1.9123759*10^(-5))*x^6 - (6.0569249*10^(-4))*x^5 +0.0026407*x^4+ 0.0193816*x^3 - 0.0956714*x^2 + 1.6439131*x + 1.0095675 (polynomial regression, polynomial power is 9)
Y(x)=1.665949*x+1.3004023 (linear regression) |
 | Cassini curve
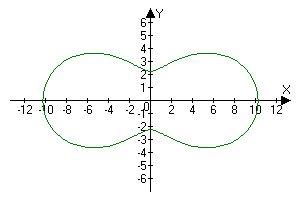
R(a)=2^2*cos(2*a)+sqrt(2.5^4-2^4*sin(2*a)^2) |
 | Addition of oscillations
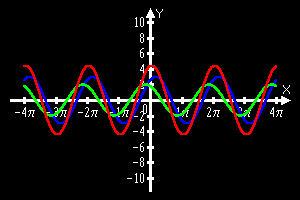
Y(x)=sin(x+1)*3
Y(x)=sin(x+2)*2
Y(x)=sin(x+1)*3+sin(x+2)*2 |
 | Smoothing
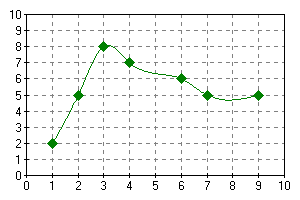
Table: 7 items |
 | Damped oscillations
Y(x)=exp(-x/4)*10*cos(x*3)
Y(x)=exp(-x/4)*10
Y(x)=-exp(-x/4)*10 |
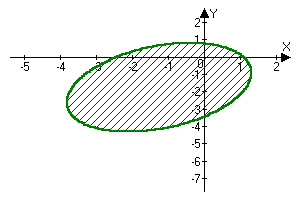 | Ellipse
3*x*x-2*x*y+x*4+y*8+3*y*y-8<0
3*x*x-2*x*y+x*4+y*8+3*y*y-8=0 |
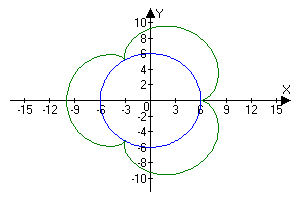 | Epicycloid
X(t)=(6+2)*cos(t)-2*cos((6+2)/2*t);
Y(t)=(6+2)*sin(t)-2*sin((6+2)/2*t)
R(a)=6 |
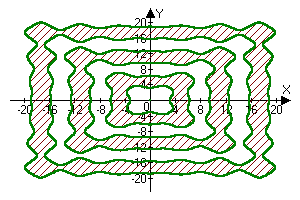 | Equation and inequality
x*sin(x)+y*sin(y)<0
x*sin(x)+y*sin(y)=0 |
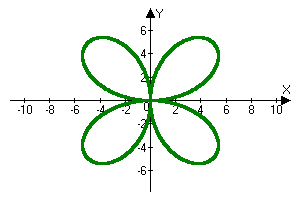 | Four-leaved rose
R(a)=7*sin(2*a) |
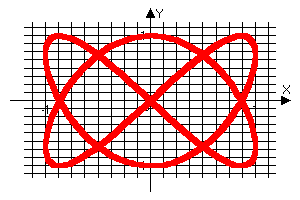 | Ortogonal oscillations
X(t)=sin(2*t); Y(t)=sin(3*t) |
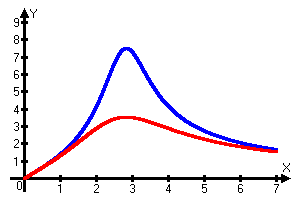 | Resonance
Y(x)=15/sqrt(4+(1.5*x-12/x)^2)
Y(x)=15/sqrt(18+(1.5*x-12/x)^2) |
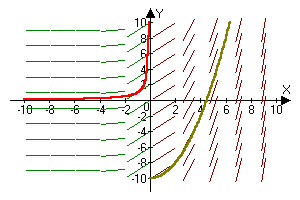 | Slope fields
dy/dx=1/x^2
dy/dx=x
Y(x)=-1/x
Y(x)=x*x/2-10 |
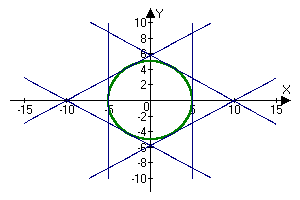 | Tangents
The equations of the tangents are obtained with the help of this program
R(a)=5
X(y)=5
Y(x)=-0.5913984*x+5.8089414
Y(x)=0.5773502*x+5.7735026
X(y)=-5
Y(x)=-0.5773504*x-5.773503
Y(x)=0.5773504*x-5.773503 |
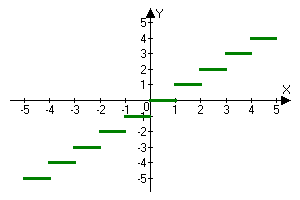 | Integer part
Y(x)=int(x) |
